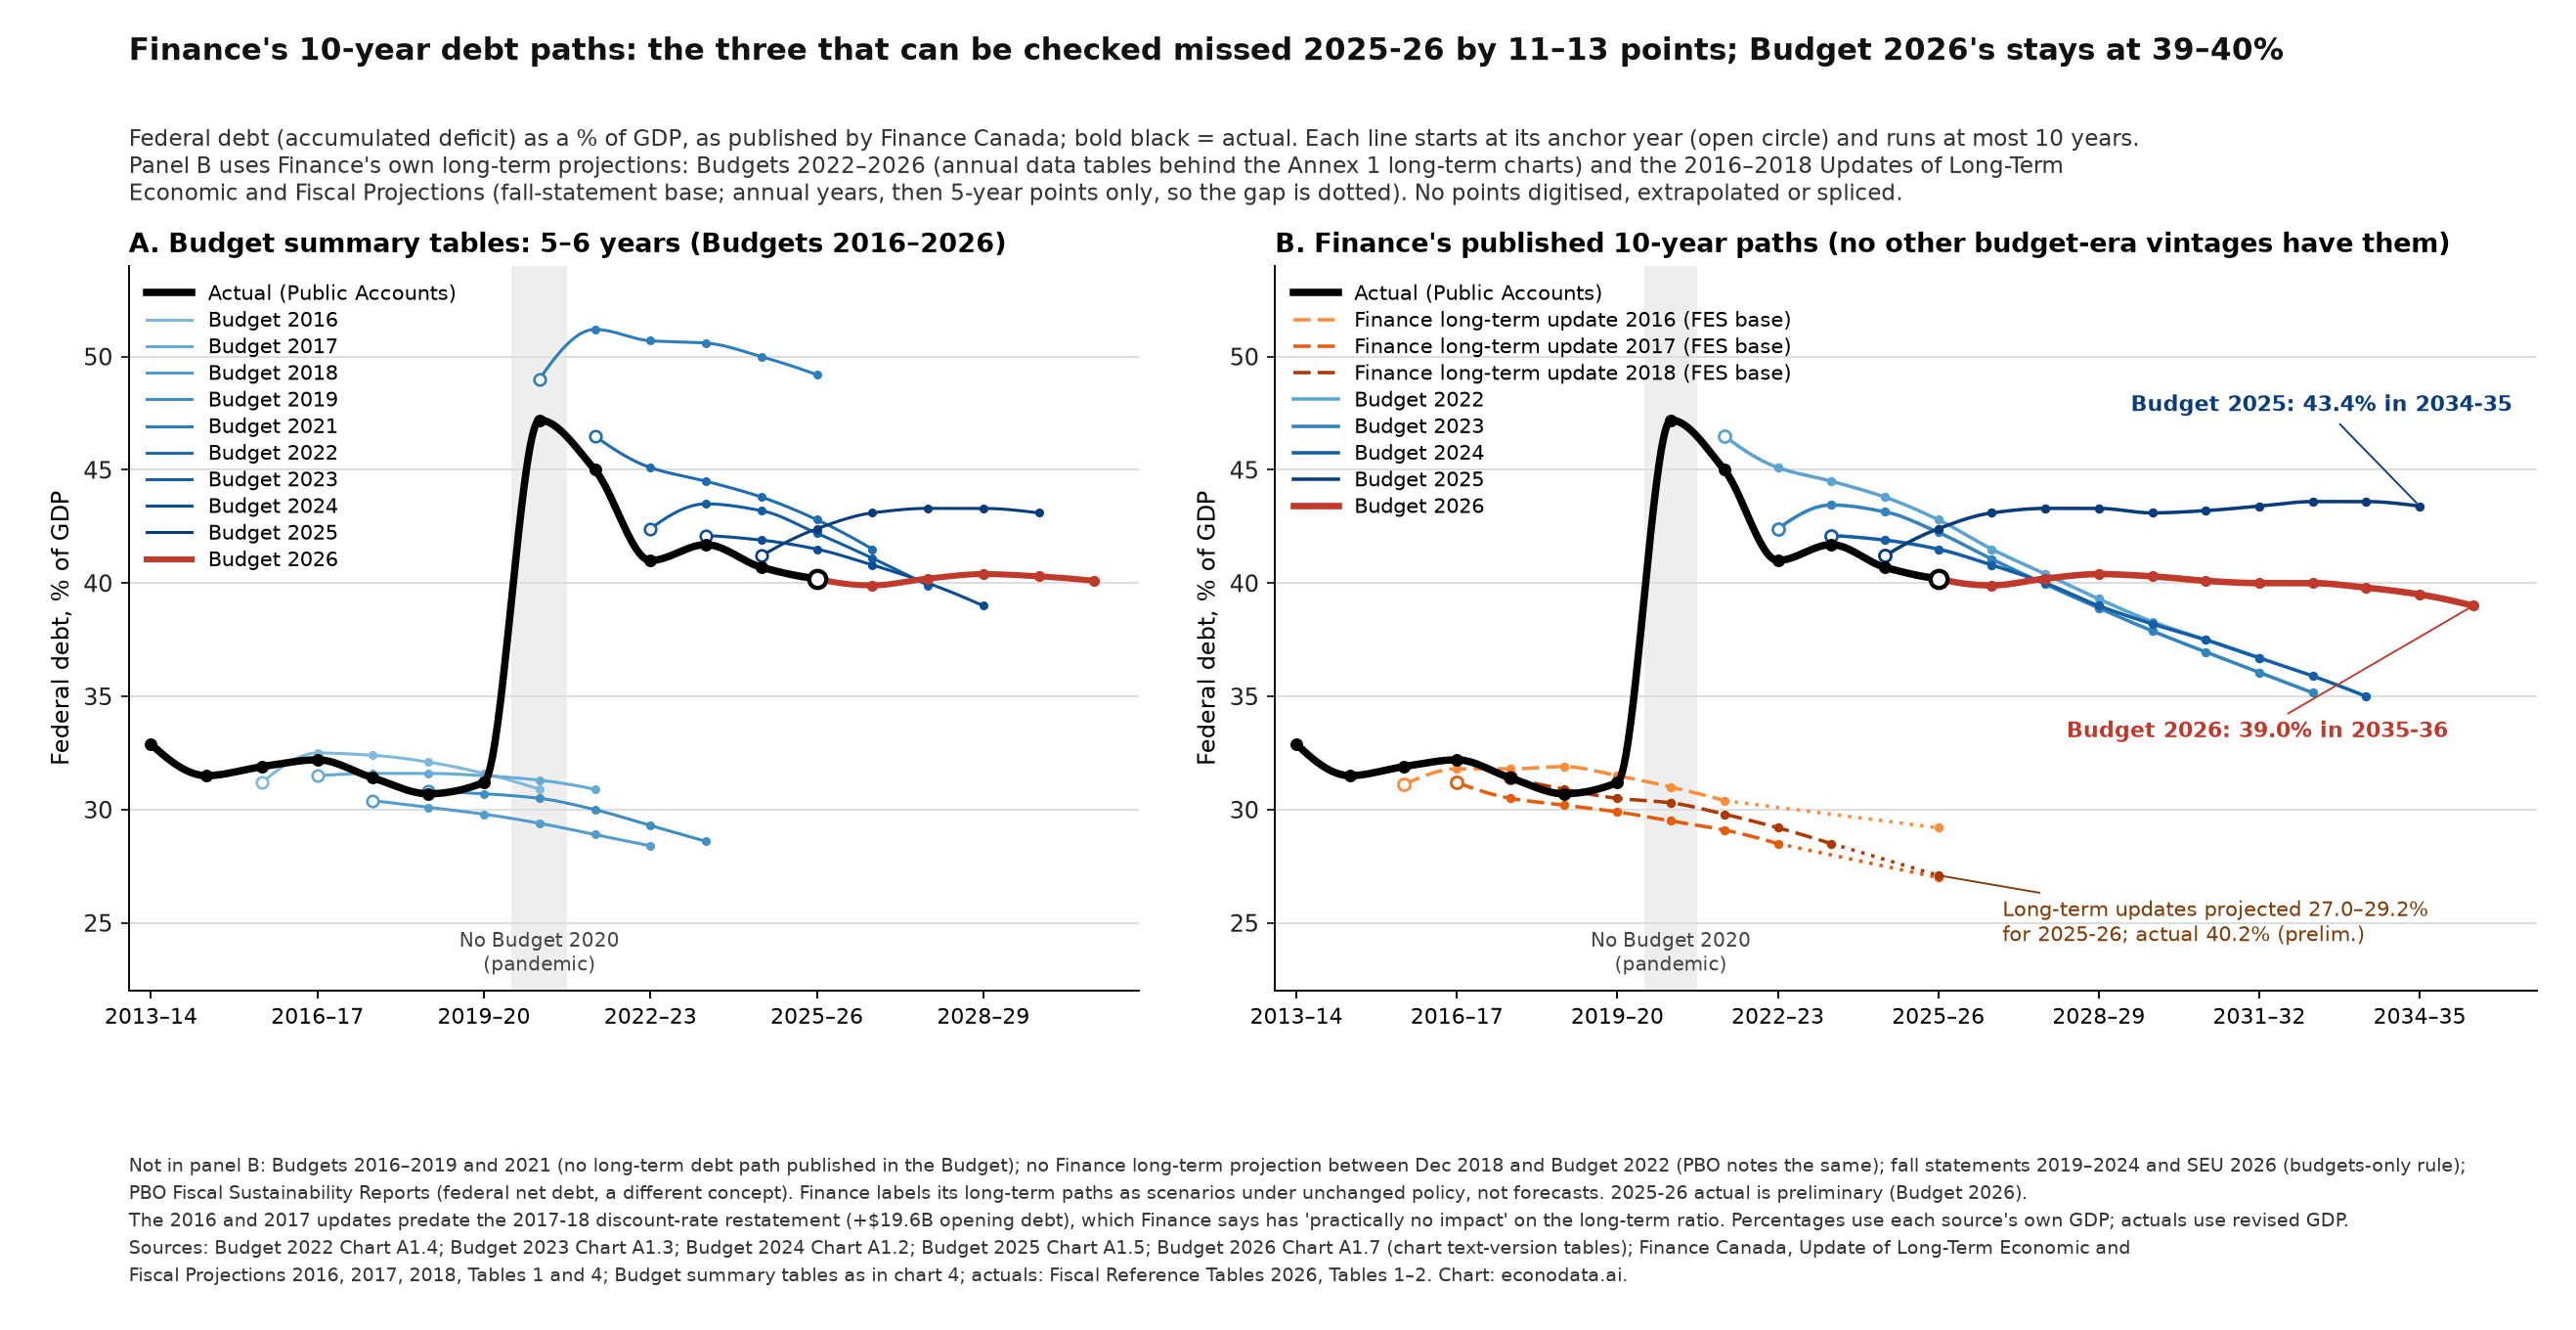
Since 2021, the federal debt-to-GDP ratio has come in below every Budget’s projection, largely because nominal GDP beat the forecasts.
Federal debt here means the accumulated deficit, the “Federal debt” rows of each Budget’s Summary Statement of Transactions. Percentages use each vintage’s own GDP forecast. Actuals come from the Fiscal Reference Tables 2026, Tables 1–2, which use current revised GDP. Each line starts at the vintage’s last actual or estimate year: the second column for spring budgets (an estimate of the year just ending) and the first column for the fall budgets of 2025 and 2026. The vintages shown are Budgets 2016, 2017, 2018, 2019, 2021, 2022, 2023, 2024, 2025 (November 2025) and 2026 (November 2026). Budget 2020 was never tabled. Fall statements and updates, including the 2026 Spring Economic Update, are left out so the comparison is among budgets.
Forecast errors (projection minus current actual):
| Vintage group, horizon | Mean error, debt-to-GDP (pts) | Mean error, $ billion |
|---|---|---|
| Pre-pandemic 2016–19, 1 year (n=4) | −0.2 | −10.1 |
| Pre-pandemic 2016–19, 2 years (n=3) | +0.2 | −6.8 |
| Post-pandemic 2021–25, 1 year (n=5) | +3.1 | +29.8 |
| Post-pandemic 2021–25, 2 years (n=4) | +4.1 | +28.8 |
| Post-pandemic 2021–25, 3 years (n=3) | +4.7 | +33.3 |
The pre-pandemic averages exclude 2020–21 and later target years. The post-pandemic dollar averages are driven by Budget 2021. Every post-pandemic projection of the debt ratio came in too high, by 1.2 to 9.7 points.
Budgets 2023 and 2024 underprojected dollar debt (the actual was $10.7–23.4 billion higher), yet overprojected the ratio by 1.2–2.5 points. Implied nominal GDP (debt ÷ ratio) came in 3.9–7.0% above their forecasts. Budget 2021’s ratio was too high by 6.2–9.7 points: debt came in 7–9% lower, and implied GDP 5–13% higher. Budget 2025, one year ahead (2025–26), projected 42.4% against a 40.2% preliminary actual. Debt came in 3.0% lower ($40.9 billion) and implied GDP 2.3% higher, so here the debt miss contributed more than GDP.
Implied GDP is derived from rounded percentages, accurate to about ±0.4%. Actual GDP includes Statistics Canada revisions, so the “GDP beat” mixes forecast error and data revision. For example, 2024–25 debt is the same $1,266.5 billion in both, but the ratio is 41.2% in Budget 2025 and 40.7% in the Fiscal Reference Tables 2026.
The same target year, in different vintages (debt-to-GDP, %):
- 2020–21: Budget 2016 30.9, Budget 2017 31.3, Budget 2018 29.4, Budget 2019 30.5; actual 47.2. The pandemic shock was missed by about 16–18 points.
- 2023–24: Budget 2019 28.6, Budget 2021 50.6, Budget 2022 44.5, Budget 2023 43.5; actual 41.7.
- 2025–26: Budget 2021 49.2, Budget 2022 42.8, Budget 2023 42.2, Budget 2024 41.5, Budget 2025 42.4; actual 40.2 (preliminary).
- 2026–27: Budget 2022 41.5, Budget 2023 41.1, Budget 2024 40.8, Budget 2025 43.1, Budget 2026 39.9.
- 2029–30: Budget 2025 43.1 versus Budget 2026 40.3. The dollar level was cut $50.4 billion ($1,590.5 billion to $1,540.1 billion), and a higher GDP path accounts for the rest.
Series are shown as published, not spliced or rescaled. Budgets 2016–2018 predate the retroactive discount-rate restatement adopted in 2017–18, so their anchor-year levels sit $14.4–19.8 billion below today’s restated actuals. Budgets 2021–2022 predate the PS 3280 asset-retirement obligations (+$5.4 billion to 2021–22) and the 2022–23 financial-instrument standards (+$2.6 billion to the opening balance). The 2025–26 actual is preliminary in Budget 2026; the Fiscal Reference Tables 2026 print the same figure.
The long-term path, and how much it moves
Budget summary tables only run five or six years. Finance’s published 10-year-plus federal debt-to-GDP paths are fewer, and they are not a complete vintage set. Budget 2026’s baseline (Annex 1 Chart A1.7, and Table A1.15) reaches 18.6% of GDP in 2060–61. Its 10-year path is nearly flat: 40.2% in 2025–26, a peak of 40.4% in 2028–29, and 39.0% in 2035–36. The long decline to 18.6% happens mostly after the 10-year window.
Only the pre-pandemic long-term updates can be checked near 10 years. For 2025–26 they projected 29.2% (2016 update), 27.0% (2017) and 27.1% (2018), against an actual 40.2% (preliminary). Those misses are 11.0, 13.2 and 13.1 points. Finance labels them as unchanged-policy scenarios, not forecasts, and they pre-date COVID. Post-2021 paths can only be checked one to four years out, and each of Budgets 2022 through 2025 came in too high over that short window (Budget 2022 by 2.6–4.1 points through 2025–26; Budget 2025 by 2.2 points for 2025–26). The 10-year endpoints also shifted up recently: Budget 2022 had 36.7% for 2031–32; Budget 2025 had 43.4% for 2034–35; Budget 2026 has 39.0% for 2035–36. For the common year 2031–32 the figures are 36.7, 36.1, 36.7, 43.4 and 40.0 across Budgets 2022–2026.
Long-term projections are sensitive to the assumptions underneath them. Table A1.15 reports the budgetary balance and federal debt in 2060–61 under alternative assumptions, applied from 2031 (Table A1.14). On interest rates, the baseline is an effective rate on federal market debt of about 3.3% over 2031–32 to 2060–61. A sustained 1 percentage point higher path takes the 2060–61 debt ratio to 30.0% of GDP; 1 percentage point lower takes it to 9.9%. The baseline budgetary balance in that year is 0.4% of GDP in every interest-rate column; the high-rate case is −0.4% and the low-rate case is 0.8%.
The same table shows other assumptions can move the 2060–61 debt ratio by a similar amount (for example, 10.1% to 28.1% under the labour-productivity alternatives). These are illustrations of uncertainty, not forecasts of those assumptions.